4 Debuggers
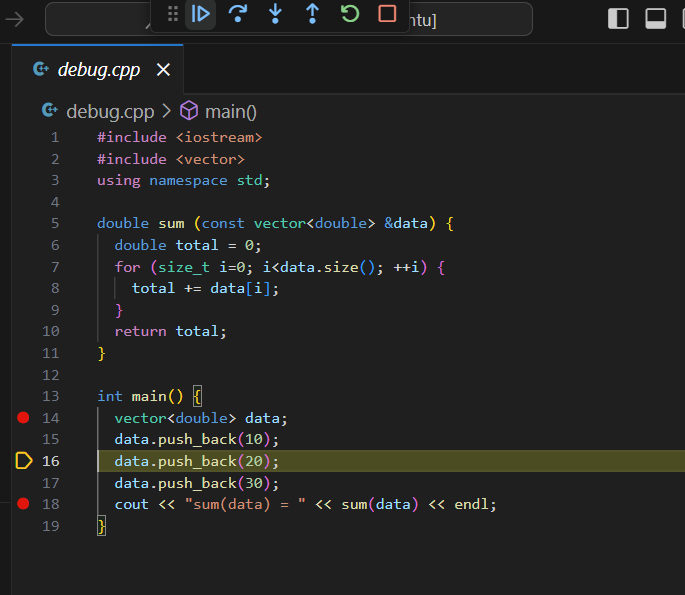
本段演示我们使用下面中这段代码:
#include <iostream>
#include <vector>
using namespace std;

double sum (const vector<double> &data) {
  double total = 0;
  for (size_t i=0; i<data.size(); ++i) {
    total += data[i];
  }
  return total;
}

int main() {
  vector<double> data;
  data.push_back(10);
  data.push_back(20);
  data.push_back(30);
  cout << "sum(data) = " << sum(data) << endl;
}
4.1 Debugging Basis

大部分 debugger 都支持以下的功能.
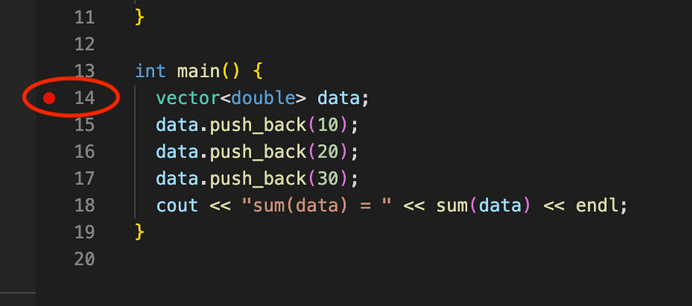
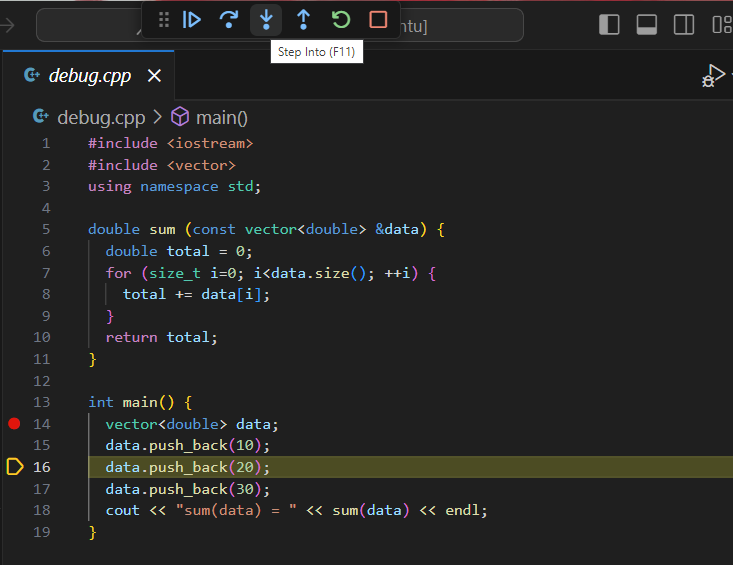
4.1.1 Breakpoint 设置间断点
Set a breakpoint by clicking to the left of a line number. A breakpoint 表示 debug 运行到这里停止. 这是 debug 的开端,就是从 breakpoint 开始可以逐行 debug
4.1.2 Step over 运行一行
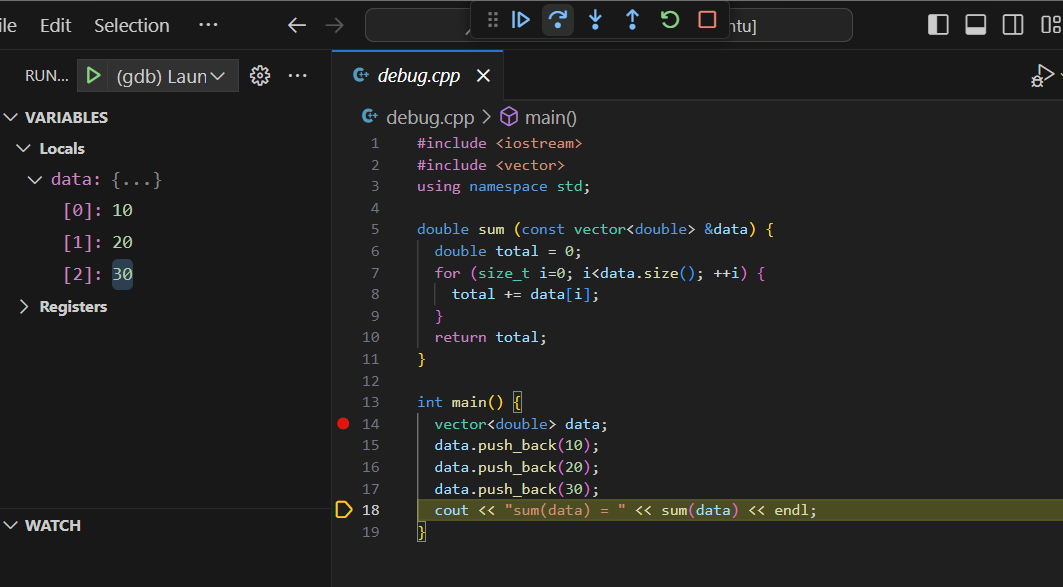
step over 就是继续运行一行的意思. 从 breakpoint 开始,我们每 stepover 一下就是运行一行.
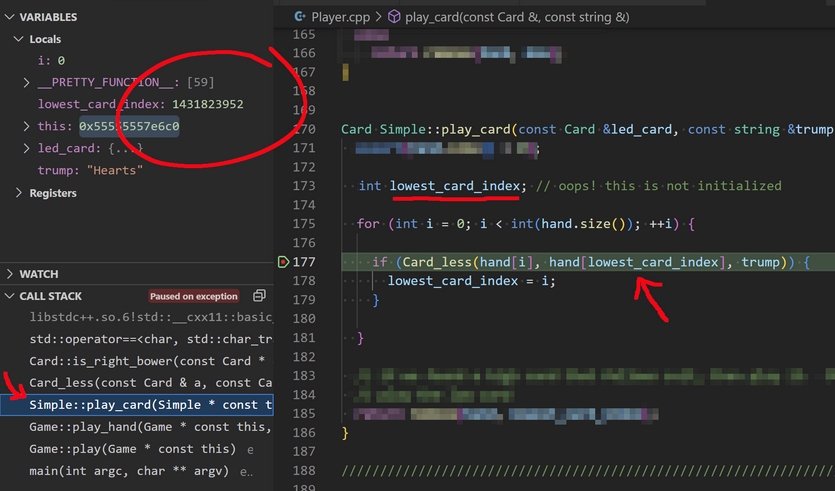
4.1.3 Inspect 查看变量
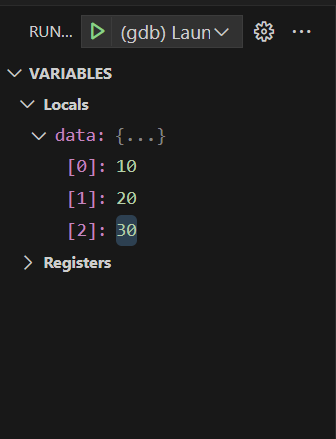
我们 stepover 的时候,左边的 local variables 会更新. 这个时候可以点开里面的数据进行 inspect,查看运行这一行之后的状态.
下面还能检查 call stack. 点击 call stack 会进入该函数的 stack frame 里面查看 varibles.
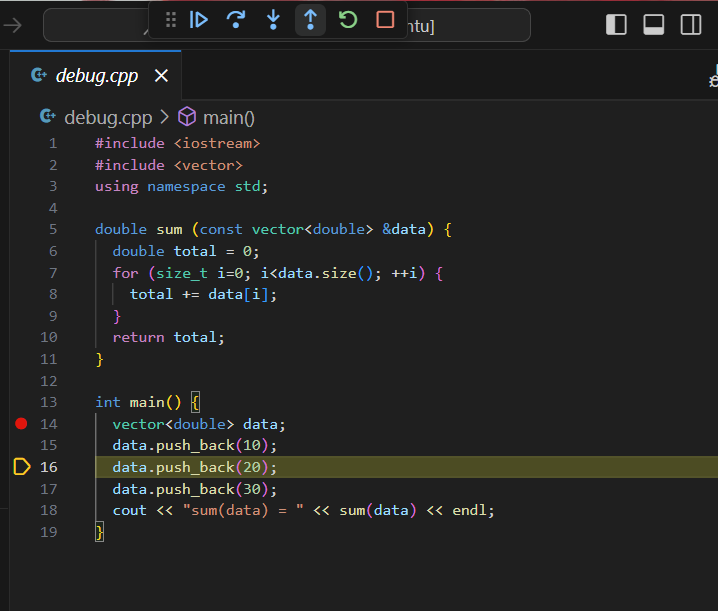
4.1.4 Step Into/Out 查看源码
Step into 会直接进入这一行使用的函数的源代码;如果查看的是库函数,会直接进入C++的库源文件中进行查看. 如果是自己写的函数,会到自己的函数这里.
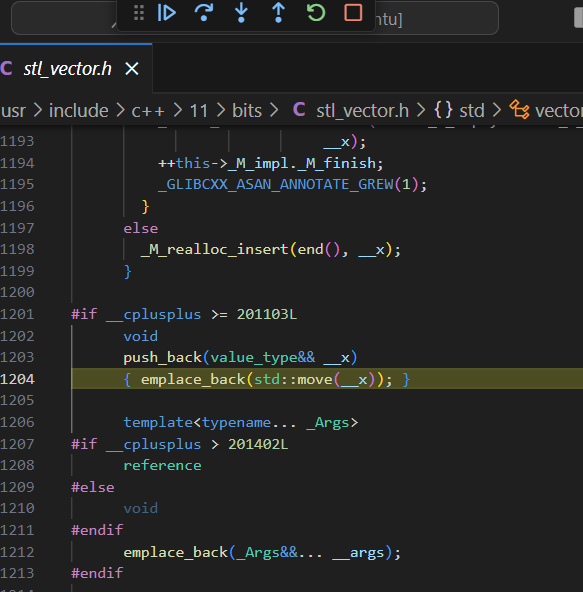
然后用 Step out 可以回到我们的文件.
4.1.5 Continue 快进到下一个间断点
Continue 可以直接快进运行到现在的位置的下一个 breakpoint.
4.2 Debug Console
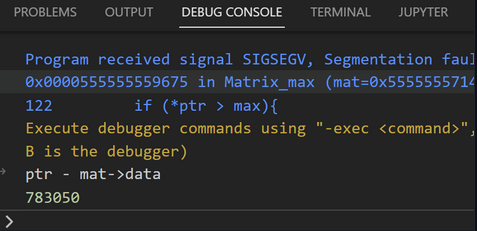
如果我们现在在进行一个 Matrix 的 debugging, 我们看到了 call stack 中的一个 ptr 变量的地址,但是不知道它指的是 Matrix 中的第几个 entry.
那么我们可以在 Debug Console 中输入 ptr - mat->data 来进行获取.
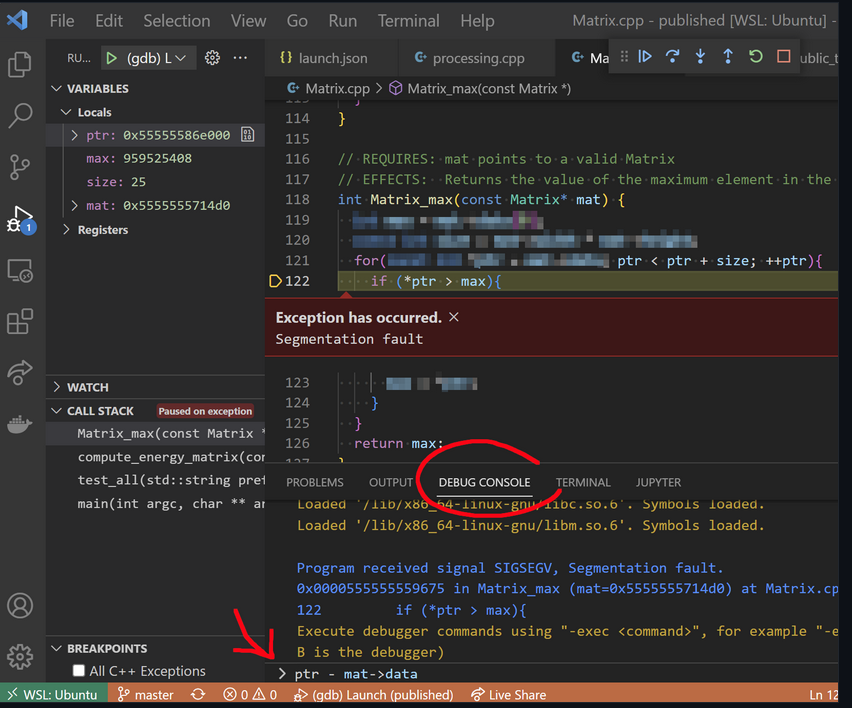
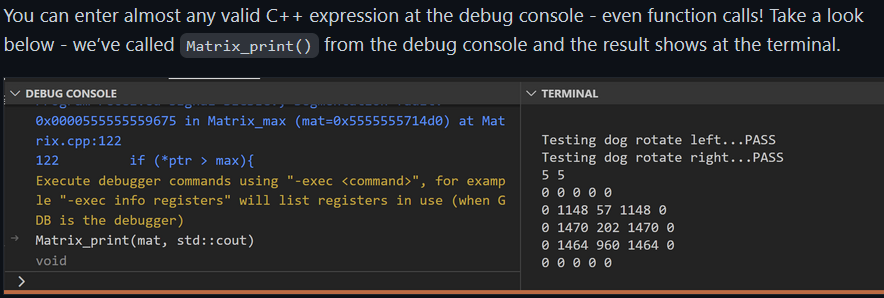
Debug Console 中可以输入任何 C++ expression,甚至包括 function call.
4.3 Address Sanitizer 地址检查器
We recommend enabling the address sanitizer 地址错误检查器 and undefined behavior sanitizer 未定义行为检查器. These will help you find memory errors like going off the end of an array or vector.
- 首先编辑
Makefile添加这些CXXFLAGS.
WSL or Linux: Add compiler flags (1) -fsanitize=address, (2) -fsanitize=undefined, (3) -D_GLIBCXX_DEBUG. For example:
CXXFLAGS = --std=c++17 -Wall -Werror -pedantic -g -fsanitize=address -fsanitize=undefined -D_GLIBCXX_DEBUG
macOS: Add compiler flags (1) -fsanitize=address, (2) -fsanitize=undefined. (ma cOS不添加 -D_GLIBCXX_DEBUG.) For example:
CXXFLAGS = --std=c++17 -Wall -Werror -pedantic -g -fsanitize=address -fsanitize=undefined
最后效果是:
CXX ?= g++
CXXFLAGS ?= --std=c++17 -Wall -Werror -pedantic -g

# Add sanitizer flags for identifying undefined behavior.  The flags are
# different on macOS (AKA Darwin) and Windows/WSL/Linux.
UNAME := $(shell uname -s)
ifeq "$(UNAME)" "Darwin"
    CXXFLAGS += -fsanitize=address -fsanitize=undefined
else
    CXXFLAGS += -fsanitize=address -fsanitize=undefined -D_GLIBCXX_DEBUG
endif
- 在
launch.json中进行添加 address sanitizer 的 arguments.
For MacOS: 编辑 "env" property in your launch.json. 如果和下面这个不一样就replace it. 如果没有就添加下面这行到 "args" property.
  "env": {
      "ASAN_OPTIONS": "abort_on_error=1:detect_leaks=0"
  },
For WSL/Linux: 编辑 "environment" property in your launch.json. 如果和下面这个不一样就 replace it. 如果没有就添加下面这行到 "args" property.
  "environment": [
    {
      "name": "ASAN_OPTIONS",
      "value": "abort_on_error=1:detect_leaks=0"
    }
  ],
- 当 address sanitizer 发现 error 时会显示一页机器码,这没什么用而且很烦人. 关掉的方法是 Code > Settings > Settings> set the
lldb.showDisassemblyoption tonever.
4.3.1 Leak Checking
address sanitzer 还可以用来检测 memory leak. 但是仅限于 WSL/Linux.
macOS 要在 shell 里面在 make 后加入一行
make main.exe
MallocStackLogging=1 leaks -quiet -atExit -- ./main.exe
注意这个检测器和 address sanitizer 不兼容 (因而还要把 makefile 里面的 address sanitizer 去掉).
这样子在运行 exe 文件的时候就会告诉你 memory leaking 的问题.
make main.exe
./main.exe
# Hello Leaks!

# =================================================================
# ==1905936==ERROR: LeakSanitizer: detected memory leaks

# Direct leak of 4 byte(s) in 1 object(s) allocated from:
    #0 0x7f54a90ae7b0 in operator new(unsigned long) (/lib64/libasan.so.5+0xf17b0)
    #1 0x400a73 in main /home/awdeorio/leakcheck/main.cpp:6
    #2 0x7f54a8303cf2 in __libc_start_main (/lib64/libc.so.6+0x3acf2)

# SUMMARY: AddressSanitizer: 4 byte(s) leaked in 1 allocation(s).
4.4 Assertions
The <cassert> header defines an assert() macro,我们传给它布尔参数作为 condition:
- 如果 condition is true, nothing happens.
- 如果 condition is false, the program crashes immediately.
#include <cassert>

int main() {
  int x = 2;
  int y = 5;
  assert(x + 3 == y); // true, all good :)
  assert(x > y); // false, crash!! (╯°□°)╯︵ ┻━┻
}
terminal 会显示错误:
test.exe: test.cpp:7: int main(): Assertion `x > y' failed.
Aborted
这可以检测一些 precondition, invariant 等.
4.5 Command-Line Debuggers(gbd,lldb)
IDE 里面集成了 debugging 的流程,但是我们也可以在 terminal 直接用 gdb/llbd 来进行 debug.
但是这之前我们首先要用 g++ 来 compile 完 exe 文件.
4.5.1 CL Debugging 命令
| command | what it does |
|---|---|
b main |
breakpoint on main function |
b 13 |
breakpoint on line 13 of current file |
b main.cpp:13 |
breakpoint on line 13 of main.cpp |
r |
run or rerun |
l |
list a few lines of code |
n |
step over (next) |
s |
step into |
up |
step out (up) |
c |
continue |
p myvar |
print variable myvar |
refresh |
refresh TUI view |
bt |
backtrace, useful for segfaults |
q |
quit |
4.5.2 Input Redirection
自动化输入
gdb:
gdb main.exe
...
(gdb) r < main_test.in
...
而 lldb 要复杂一点:
lldb main.exe
...
(lldb) settings set target.input-path main_test.in
(lldb) r
...
4.5.3 Arguments and optins
我们之前在 VSCode 里在 launch.json 里面放 arguments and options,那么当然也可以直接用 command 实现.
./main.exe train_small.csv test_small.csv --debug
main.exeis the name of the programtrain_small.csvandtest_small.csvare arguments--debugis an option
4.6 More Pro Tips for debugging
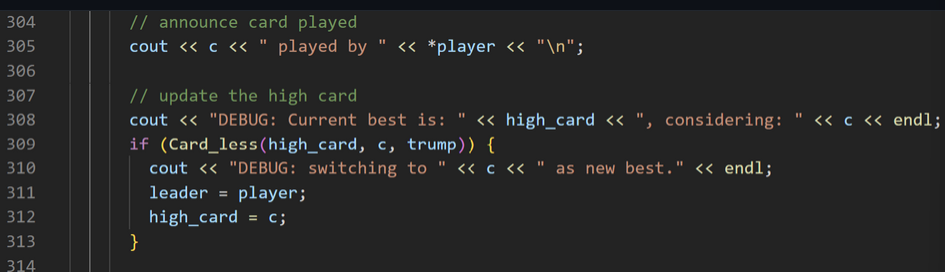
4.6.1 Debug Logging 额外输出
在一些循环中我们发现异常,可以专门写一些额外的 output 用以 debug.
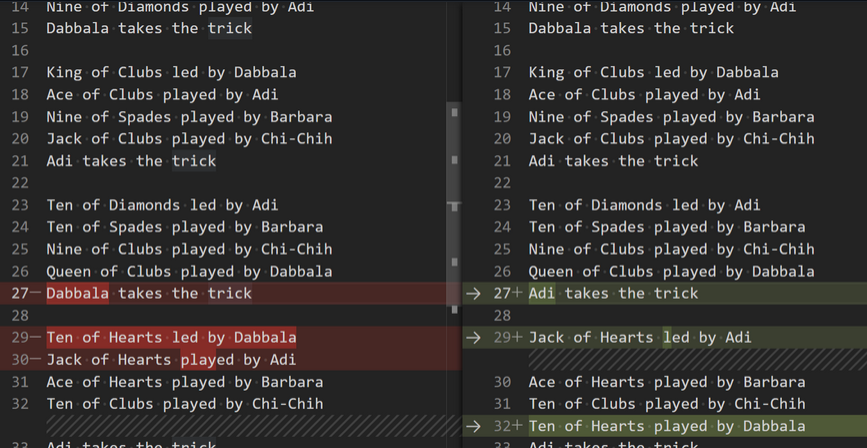
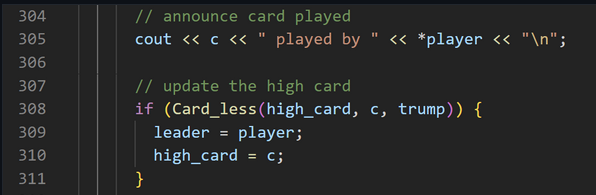
专门加一些话用来 Debug,并且加上标识来和普通的输出区分开.
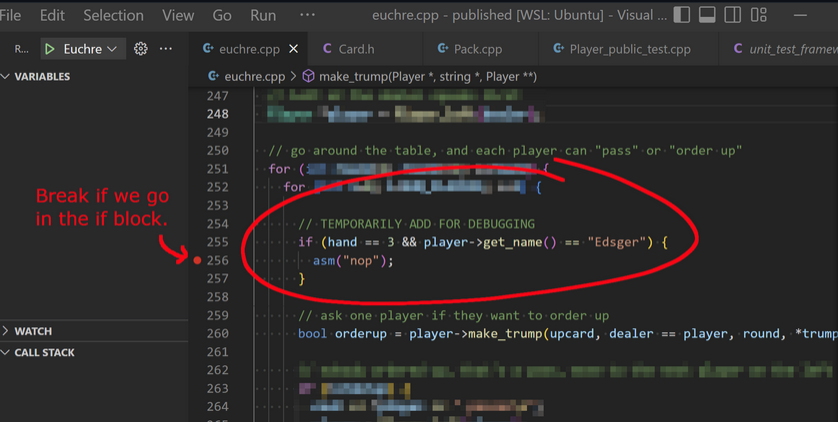
4.6.2 Conditional Breakpoint
接上一条,我们可以人为地加一些 if 语句来 debug,并且把 BreakPoint 放在 if 语句的内部时,就可以快速知道某一时刻某个时刻变量的值是不是预期的值.
这样就可以一眼检测某个时刻某个 variable 的值是不是我们想要的值,这样不仅可以 debug 还可以顺便 testing.